12s Engulfing Pattern
Engulfing Pattern
As noted above, the hammer and the hanging candle are separate candles.
warning about the change in market trend. However, the majority
Other signals generated by candlestick charts are
a combination of several candles. So the absorption model is one of
key turn signals - consists of two candles, which, like
They are usually painted in different colors.


The factors that increase the likelihood of a change are listed below market trend after a pattern appears on the graph acquisitions:

Figure 4.18 shows a bullish takeover model. During
The downward trend is a candle with a bullish white body that
It covers the black body of the previous candle, as if it were absorbing it.
This shows that the pressure of buyers has become greater
seller pressure. In turn, in Figure 4.19 is the bear
absorption model in which the white body of the first candle is completely
is covered by the next black body of the second. This model
occurs in a period of growing market and is a signal of reversal on
top.
The absorption model must meet three criteria:
1. The market shall have a marked upward or
A downtrend, at least a short-term one.
2. The body of the second candle should cover the body of the first (at the same time
shadow absorption may not occur).
3. The colour of the second body shall be different from that of the first. Exception
only if the first candle has so
a miserly body that resembles a doji or is a doji. Taku
if after a long downward trend
A tiny white body is absorbed by another white body, but very
A big one, you can talk about the turn signal at the base. When
The uptrend is the absorption of a very small black body
The big black will serve as a turning signal at the top.
In Western technical analysis, the closest model analogue
The takeover is the reversal day. This is the day when the
An upward (or downward) trend is achieved by a new price
maximum (minimum), but the auction ends at the level below (above),
than the closing price of the previous day. However, the absorption model
Even then, you can get signals about the upcoming trend change when
There is no need to speak about the coming of the day of turning. It will be seen,
for example, in figures 4.21, 4.22 and 4.23.


The factors that increase the likelihood of a change are listed below market trend after a pattern appears on the graph acquisitions:
1. If the first candle of the model has a very short body, and the second one —
very long. This shows that the old trend
it's weakening, and the new one's gaining strength.
2. If the absorption model is formed after a long trend either,
on the contrary, after the sharp movement of the market. In the first case, many
potential buyers have already managed to take long positions (or
sellers - open short), so you can hardly expect
a large number of new purchases (sales) that are necessary for
maintaining the trend. In the second case, the market becomes
very sensitive to fixing profits, which is highly likely
after a rapid rise or fall in prices the day before.
3. If the second candle of the absorption model occurs against the background of the high
volume of trading. This may be a sign of a situation that sometimes
Called "blow off": right after a sharp jump
The market is also rapidly retreating back. To questions
Relationship between candle analysis models and trading volumes
We'll come back to chapter 15.
4. If the second candle of the absorption model overlaps immediately
several previous bodies.
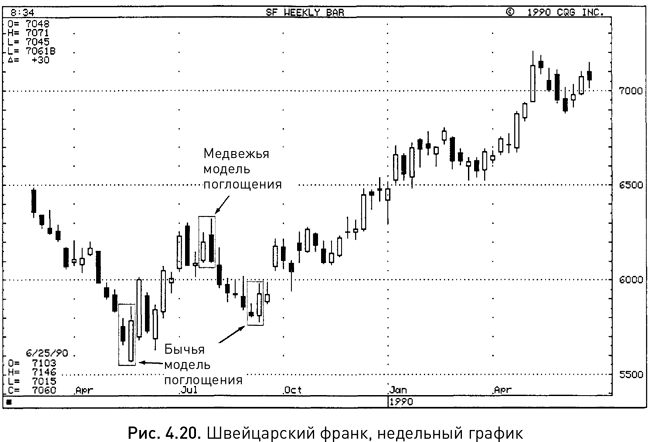
In Figure 4.20 you can see two consecutive candles (for weeks,
(those that started on May 15 and May 22) formed a bullish takeover model, and then
In the last weeks of July a bearish model appeared. Finally, one more
The pattern of absorption, this time bullish, formed in September and served
the starting point for a long rally.
The oil graph shown in Figure 4.21 clearly shows
bullish and bearish takeover models. At the end of 1985, a sharp
$20 drop, followed by two candles in March and April 1986
formed a bullish takeover model. The rally that started with it
It continued until the bearish takeover model emerged in the middle
1987, and then the downward trend that, in its
The queue ended with a small bullish takeover model at the beginning
1988 Then, for five months, there was sideways price movement.
The body of the black candle, which appeared in February 1990, was not enough 8
Tics for the absorption of the January white body, and therefore the ideal
The absorption model did not work. But again,
Candlelight analysis, like other technical tools, allows
There are some exceptions to the rules (and therefore there is always a stake in it)
subjectivity). It made much more sense not to ignore this combination
candles, and consider it as a signal about the reversal of the trend.
In this illustration, the bearish takeover models of 1987 and 1990.
demonstrate their advantage over the "turn day" indicator,
Because only they signaled a future trend change. Price
The candles must rise to a new high and then fall to
The day of turning on the top (or, as in this case, a month)
A U-turn on the top.) But here the black candles did not reach the previous ones
price highs, and thus a reversal, could have been predicted
only bear candle models.
The example in Figure 4.22 also shows the superiority of candles over
Barometric charts. Please note the price dynamics on July 7 and 8,
which were not days of turning, because there were no days of turning.
New price records were recorded. At the same time on a candlestick chart
a bearish takeover model has emerged, signaling a likely trend reversal.
On the same chart, candles 1 and 2, which appeared in early June,
resemble a bullish takeover model. But this model is
trend reversal indicator in the base, which means formed on
falling market (or sometimes at the lower bound of the side trading
range). In this case, the market did not show a decline, so
No action should have been taken after this
candle combinations.
Figure 4.23 shows a series of bearish takeover models, the first
Of which the uptrend was interrupted and the market was directed to the sideways
The corridor was closed for several months, and the second only briefly interrupted
the rally at the time. Bearish Takeover Models 3, 4, and 5
They gave signals about a trend reversal that could not be detected
Alternatively: in all these cases the second candle of the model is not
reached the price high, so could not be considered a week
spread.

Comments
Post a Comment